Temperatures in context
Compare indoor, heating buffer, hot water and outdoor temperatures. Charts reveal how readings change over time.
Portfolio
MyHome by improveIT.pl brings home systems, temperatures and energy into one desktop and mobile interface. Its dashboard presents heating, hot water, heat pump operation, solar production and current consumption. Scenes, schedules and quick actions help align home operation with daily routines, with a detailed desktop view and convenient access on a phone.
Heating, device, temperature and energy information is often scattered across several panels. This makes it difficult to see relationships, understand operating changes and choose the right mode for the home.
MyHome combines key readings in a dashboard with a visual home systems overview. Device statuses sit alongside temperature charts, energy summaries, events and quick actions. The desktop experience supports analysis and configuration, while mobile puts key status information and actions within reach.
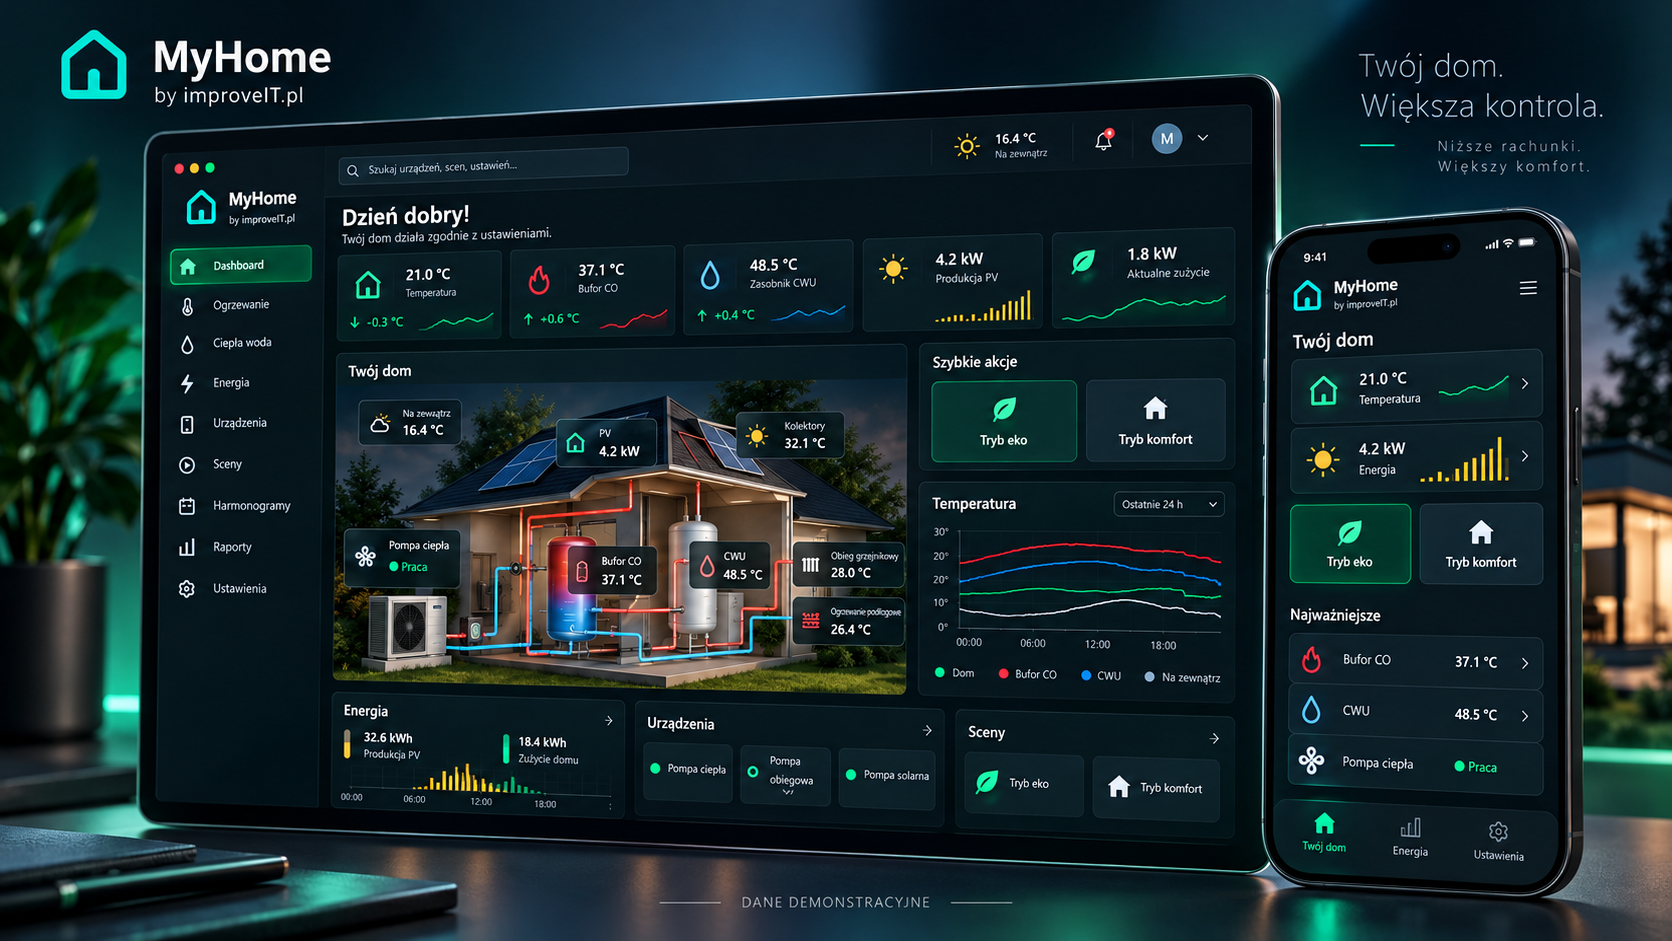
Bring key home readings together to understand the current state of the installation.
Compare indoor, heating buffer, hot water and outdoor temperatures. Charts reveal how readings change over time.
Solar generation and household consumption views support comparisons across a day, week or month. Decisions can be based on measurements without promising a specific level of savings.
Connect the house, heat pump, buffer, hot water and heating circuits in one view. Readings and statuses make device operation easier to understand.
Scenes and schedules organize repeated tasks and make operating mode changes easier.
Eco, comfort, night and holiday modes provide clear entry points for different situations. The actions performed by each scene depend on the installation configuration.
Rules can align device operation with time of day and household needs. Control capabilities depend on supported equipment and available integrations.
Device lists and event history show operation starts, state changes and target temperatures being reached, providing context for checking system behavior.
Two ways to use one product, with layouts matched to the screen.
The dashboard has room for a systems overview, multiple charts and device summaries, supporting data comparison and configuration.
The mobile view prioritizes home status, key readings and quick actions. Access outside the home network depends on the agreed connection architecture.
Before deployment we define equipment, available interfaces, readings and control capabilities. The presentation does not imply compatibility with every manufacturer or installation.